
boAt: how Aman Gupta and Sameer Mehta scaled affordable audio—and why moving premium is harder
Case study ·
boAt scaled accessible electronics through outsourced production and marketplace distribution. Its premium push tests whether that model can deliver differentiation without sacrificing volume or cash.
boAt scaled accessible electronics through outsourced production and marketplace distribution. Its premium push tests whether that model can deliver differentiation without sacrificing volume or cash.
| Company | boAt Lifestyle |
|---|---|
| Founders | Aman Gupta, Sameer Mehta |
| Founded | Imagine Marketing incorporated in 2013; the supplied prospectus and brand website date boAt to 2014, while Mint reports a 2016 brand launch., Mumbai registered office and South Delhi corporate office in the January 2022 prospectus; Gurugram headquarters according to Mint in October 2025. |
| How it makes money | Imagine Marketing earns revenue by selling branded consumer devices, primarily audio products and wearables, using contract manufacturers and selling through online marketplaces, distributors, retailers and its website. |
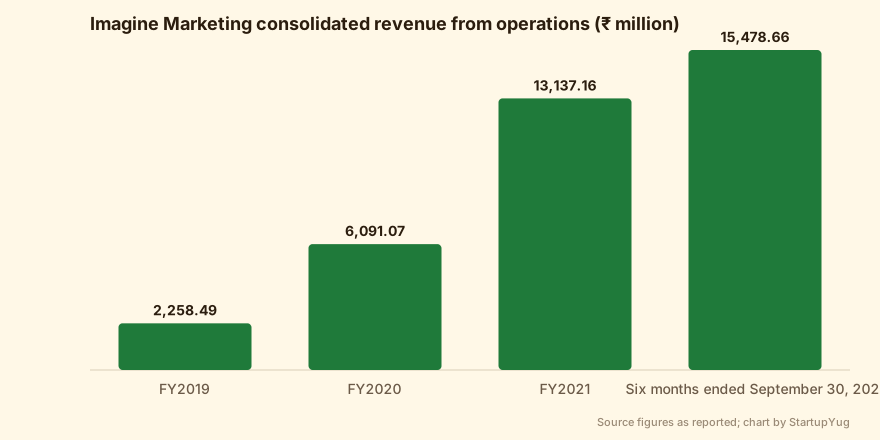
| Imagine Marketing consolidated revenue from operations (Six months ended September 30, 2021) | 15,478.66 — Imagine Marketing Limited DRHP (copy) |
The opportunity: affordable branded electronics, not just cheaper gadgets
The opportunity behind boAt was not simply to sell cheaper gadgets. RedSeer’s industry discussion in Imagine Marketing’s draft prospectus describes wider access to technology and suppliers bringing down hearables and wearables prices, while online marketplaces and word of mouth helped consumers discover affordable brands. The mechanism connected supply with discovery: electronics became more accessible to buyers, and emerging brands had routes to reach them. This is industry analysis, not proof that these factors caused boAt’s growth.
The legal company and consumer brand have distinct starting points. According to the prospectus, Imagine Marketing was incorporated as Imagine Marketing Private Limited in Mumbai on November 1, 2013. The prospectus dates the launch of its flagship boAt brand to 2014, as does the company website, whereas Mint says Imagine Marketing launched boAt in 2016; the sources do not resolve that disagreement.
On its company website, boAt says founders Aman Gupta and Sameer Mehta identified customers seeking affordable, durable and fashionable audio products. That establishes the intended proposition, not independently verified durability. Affordability was therefore only part of the pitch: the company also wanted audio products to function as lifestyle purchases. The supplied record does not establish a first-product sequence that would justify a more specific origin anecdote.
The same market structure also made differentiation difficult. In its October 2025 report, Mint describes pandemic-era homegrown brands competing on price with near-identical earbuds and smartwatches. Accessible products could expand the market without giving each brand a durable reason to charge more. IDC India’s Navkendar Singh told Mint that shedding boAt’s value identity would be difficult, with changes in product strategy and brand image risking customers and revenue. The commercial tension was already embedded in the opportunity: winning recognition for affordability did not automatically establish willingness to pay a premium.
“In a stagnant market, there’s little room for reshuffling product strategy and brand image without losing customers and taking a hit to revenue.”
— Navkendar Singh, associate vice-president, IDC India, Mint
The founders: relevant experience, but an incomplete origin record
boAt’s company website identifies Aman Gupta and Sameer Mehta as its founders. Their documented backgrounds show prior exposure to electronics and consumer-brand building, but do not establish how they met or agreed to work together.
Mint’s report of 31 October 2025 places Gupta at Citibank, KPMG and electronics group Harman before boAt. It identifies his chief marketing officer role and attributes his emergence as the brand’s public face largely to his marketing efforts and popularity through Shark Tank India. That explains his later visibility; it does not establish his responsibilities at inception or quantify what that visibility contributed to sales.
Mint describes Mehta as maintaining a lower public profile. Between 2007 and 2015, he attempted to build a consumer-facing technology brand through Redwood Interactive. He also serves as executive director of Kores’s India arm. The Redwood experience is relevant evidence of an earlier attempt in consumer technology—not evidence of its commercial success. The supplied account gives neither its costs nor its results.
The chronology is inconsistent: boAt’s website dates its start to 2014, while Mint dates the brand launch to 2016 but also places Gupta’s entrepreneurial start with boAt in 2014.
Relevant experience is documented; the founding mechanics are not. The supplied sources do not establish initial capital, educational histories or an early division of responsibilities. Assigning marketing to Gupta and operations to Mehta from day one would therefore go beyond the evidence.
The earliest measurable traction: an audio-led business
The earliest measurable traction in the supplied financial record starts in FY2019, not with a verified first sale. boAt’s “Who We Are” page describes its intended audience and affordable-audio proposition, but does not establish the first product, its launch price or how the first customer was acquired.
Imagine Marketing’s draft prospectus provides a firmer baseline: revenue from operations rose from ₹2,258.49 million in FY2019 to ₹6,091.07 million in FY2020 and ₹13,137.16 million in FY2021. These are Imagine Marketing consolidated figures, not a separately disclosed boAt-only revenue series. They establish rapid commercial expansion, but cannot identify which launch or acquisition tactic first made the brand work.
The category mix shows what supported that expansion. According to the prospectus, audio represented 96.01% of revenue from operations in FY2019, 97.64% in FY2020 and 93.52% in FY2021. Wearables revenue was nil in FY2019 and FY2020, then reached ₹548.05 million in FY2021. The early financial story was therefore overwhelmingly audio-led; wearables entered the reported revenue mix after the business had already achieved substantial sales.
Expansion became more visible in the interim six months ended September 30, 2021. Revenue from operations reached ₹15,478.66 million, with wearables contributing 14.05%, according to the same prospectus. That interim revenue exceeded the preceding full financial year, but it is not a full-year result or a basis for annualising sales. The filing explicitly notes that marketplace shopping events and Indian festive seasons substantially affect revenue.
Management attributed expansion partly to new categories and channels. It also warned that entering new product markets might not preserve past profit margins. The category figures demonstrate diversification in sales, not its standalone economics: they do not isolate the cost of entering wearables or establish that wearables matched audio’s profitability.
Product and pricing: affordability is a negotiated commercial model
boAt’s affordability was a commercial arrangement, not simply a low sticker price. In its draft prospectus dated January 26, 2022, Imagine Marketing says it differentiates certain products through affordable pricing coupled with quality. Prices reflect product costs, other costs and promotional discounts. That establishes the intended positioning—not the profitability of an individual earbud or smartwatch.
Crucially, pricing power was shared with the channel. The prospectus says prices, and changes to them, require mutual agreement with marketplaces or distributors. It warns that rising costs may not be passed through to customers, and that discounts may neither preserve margins nor continue to attract demand. The commercial tension is clear: keeping a product accessible can require absorbing costs rather than raising its price.
Discounting was also managed rather than left entirely to retailers. Under certain marketplace agreements, the company mutually agreed price ranges and discounts, and monitored listings to prevent deeper-than-permitted reductions. The prospectus acknowledges that these policies could affect channel inventory levels. Protecting a price point therefore involved a trade-off with how much stock channel partners might hold; it was not just a branding decision.
Features offered another route to differentiation. Citing RedSeer, the prospectus describes Xtend as among India’s earliest Alexa-compatible, voice-enabled smartwatches. This is evidence of bringing a feature combination to market, not proof that the underlying technology was proprietary. The supplied disclosures do not establish Xtend’s unit margin or whether customers paid a premium for those features.
The company’s undated catalogue lists earbuds, neckbands, smartwatches, speakers, soundbars, charging products, dashcams, projectors and trimmers. It demonstrates breadth, but establishes neither launch chronology nor category revenue. Nor does it show that the same pricing economics held across categories: that would require product-level realised prices, discounts and costs, which the supplied sources do not provide.
Distribution: digital-first did not mean direct-to-consumer
Digital-first described boAt’s route to market, not a predominantly direct-to-consumer business. Imagine Marketing’s DRHP reported that online marketplaces generated 85.11% of revenue from operations in FY2019, 86.26% in FY2020 and 85.84% in FY2021. The top two marketplaces alone contributed 78.59%, 81.35% and 83.72%, respectively. The supplied excerpts do not identify those marketplaces. While the overall marketplace share stayed broadly stable, dependence on the leading pair increased. (DRHP, printed page 33.)
The attraction was reach without first building an equivalent physical distribution network. The company credited its digital-first approach with rapid market penetration and access to near-real-time ratings and reviews that informed demand forecasting and product development. It also reported substantial sales increases during marketplace shopping events and Indian festive seasons. These channels provided access to demand, but made marketplace promotions and ordering patterns important to boAt’s sales planning. (DRHP, printed pages 143 and 40.)
That reach came with concentrated commercial dependence. Arrangements with the top two marketplaces were non-exclusive, and the company warned that it could not guarantee promotional access. Competitors offering better terms could cause channel partners to de-emphasise its products. This was a bargaining-power risk, rather than evidence that any particular marketplace had already imposed worse terms. (DRHP, printed page 33.)
Selling into a channel did not necessarily end boAt’s inventory exposure. Contracts with a few customers required repurchases or additional price support for products left unsold after a specified period. Certain return scenarios could require repurchasing the entire quantity at the original selling price. Payment exposure was already observable: the company reported past collection delays following temporary operational changes at certain marketplaces, without quantifying their duration or cost. (DRHP, printed page 33.)
Offline distribution broadened access, but offered limited contractual certainty. As of September 30, 2021, the network comprised over 51 distributors, over 180 sub-distributors and presence in over 23,000 stores across approximately 32 states and Union Territories. Distributors had no long-term agreements; most were not committed to specific business volumes and could terminate relationships at short notice. Store presence therefore did not mean guaranteed orders. (DRHP, printed page 33.)
Managing both channels also required pricing discipline. The company monitored marketplace and distributor-to-retailer pricing, mutually agreed price ranges and discounts with certain marketplaces, and maintained a dedicated monitoring resource to detect excessive online discounts. This helped limit channel pricing conflicts, but the DRHP acknowledged that such policies could affect the inventory partners were willing to hold. (DRHP, printed page 33.)

Marketing: a lifestyle identity without proven acquisition economics
boAt’s website addresses customers as boAtheads: people who love music, movement and pursuing their goals. It references the Indian Premier League and collaborations with young Indian designers. These associations frame electronics as expressions of identity rather than purchases decided solely by specifications and price. The community language gives buyers a shared label; cricket and design supply cultural connections for that positioning. (Company website)
But community language is not retention evidence. The website supplies no campaign spending, conversion or repeat-purchase data. It shows how boAt wants customers to identify with the brand, not whether that identification lowers acquisition costs or keeps them buying.
The same page claims India’s leading personal-audio position for 2020–2024, attributing it to Redseer. This is a company-published claim; the underlying report has not been independently reviewed here. Even accepting the stated position would not establish how much marketing contributed, versus pricing, product availability or distribution.
Founder visibility adds another layer. Mint links Aman Gupta’s prominence as boAt’s public face to his work as chief marketing officer and his popularity through Shark Tank India. It provides no causal estimate of sales attributable to the programme. Public recognition and incremental purchases therefore remain separate questions in the available evidence. (Mint, October 2025)
The cost commitment is clearer than the demonstrated return. In the October 2025 proposed IPO, ₹150 crore, or 30% of the ₹500 crore fresh issue, was earmarked for brand and marketing expenses, Mint reported, citing the draft document. This was a planned allocation, not historical expenditure. Its stated purpose was greater product and brand awareness and visibility—not a quantified acquisition or retention outcome. The disclosure establishes an intended use of capital, but supplies no basis for calculating its expected marketing payback.
Operations: outsourced production leaves real obligations behind
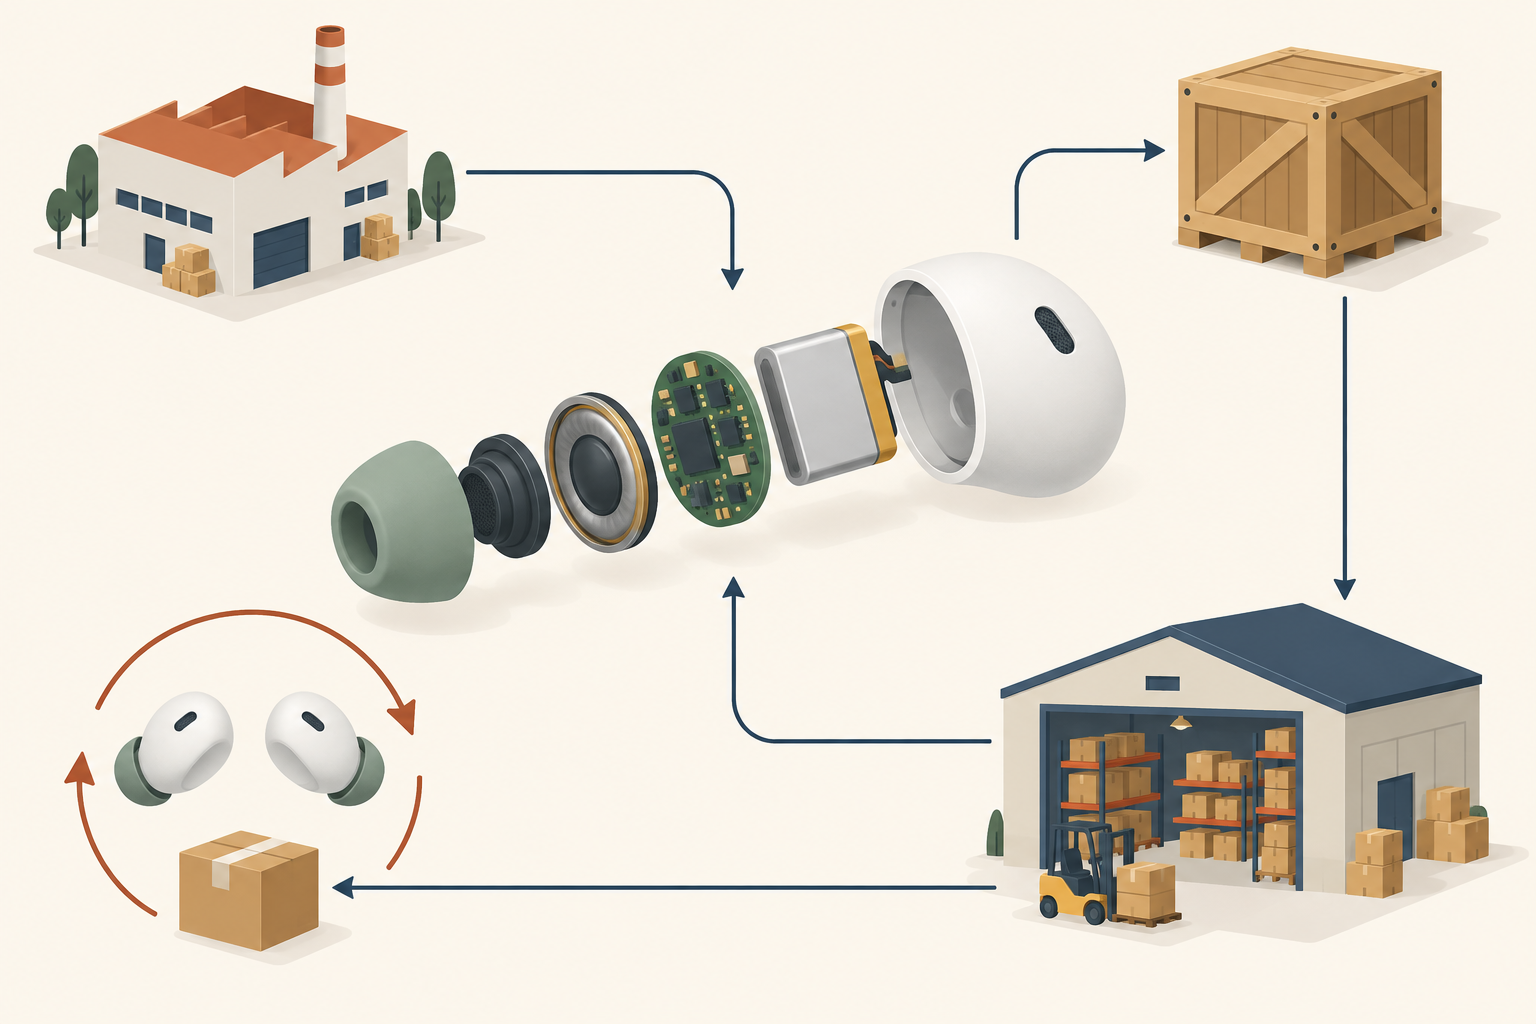
boAt outsourced production, but retained responsibility for coordinating supply and supporting the products sold under its brand. Imagine Marketing’s DRHP described third-party contract manufacturing as a source of production flexibility. The company set design specifications and quality standards, maintained manufacturing oversight and sometimes facilitated component supplies. This was not simply buying finished goods and adding a logo.
That flexibility came with concentration. Its five most-used suppliers accounted for 57.19% of stock-in-trade purchases in FY2021 and 60.73% in the six months ended September 30, 2021. Supply contracts were short-term and could be terminated without cause by either party on notice. Some exclusivity arrangements applied only within India; others depended on boAt continuing to promote the supplier’s products and cooperate on new projects. Access to manufacturing therefore did not necessarily mean durable control over it. These were disclosed contractual exposures, not evidence that suppliers had actually terminated relationships.
Logistics added another dependency. The DRHP said the company relied entirely on third-party providers for transport from manufacturing partners to the company and onward to marketplaces and distributors, alongside part of warehouse management. It believed alternative providers were available, but warned that switching could involve delays or additional costs. Outsourcing transport did not remove responsibility for delivery performance or the resulting customer experience.
Some disruption did materialise. In its pandemic disclosures, the company reported production and logistics delays of up to three months in 2020 and up to a month in 2021. This demonstrates exposure to external disruption, not that outsourcing itself caused the delays. Timing mattered because sales rose substantially during marketplace shopping events and Indian festive seasons. The DRHP warned that inaccurate product-level forecasts could leave either excess inventory or insufficient stock to meet channel demand; it did not quantify losses attributable to those forecasting risks.
After-sales obligations were already measurable. Warranty expenses rose from ₹48.87 million in FY2019 to ₹273.47 million in FY2020 and ₹527.17 million in FY2021. Their share of revenue was 2.16%, 4.49% and 4.01%, respectively: the absolute bill grew, but the expense ratio did not rise continuously.
During the six months ended September 30, 2021, replacement claims covered 4.51% of total sales orders, while products were replaced on 2.97% of total sales orders. These are distinct measures, not interchangeable defect rates. The supplied disclosure does not explain the gap. For operating planning, however, the obligation was clear: a sale generated potential replacement work and warranty expense even when another company had manufactured the product.
The money: profitable growth was not self-financing growth
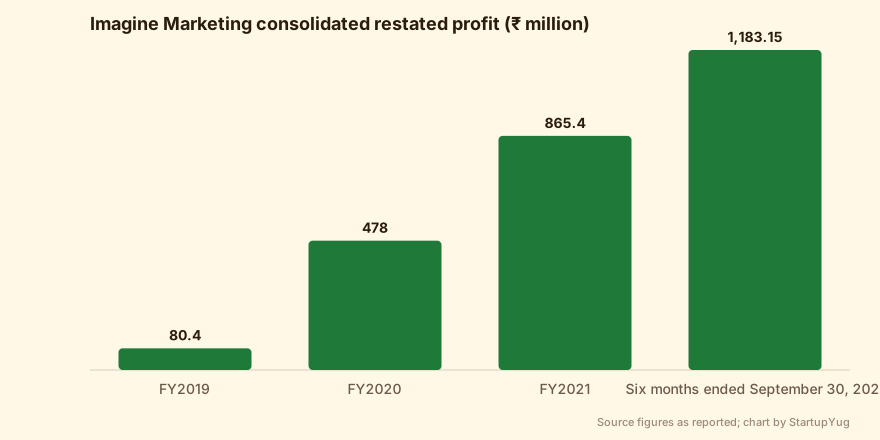
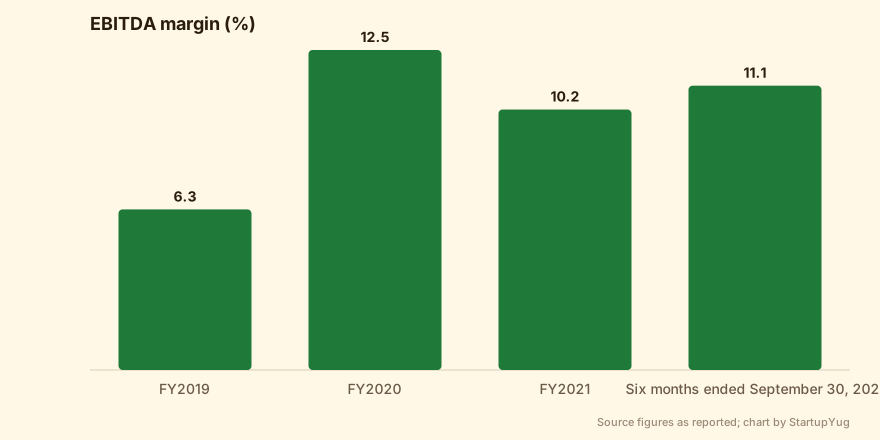
Reported profit did not mean boAt’s growth paid for itself. Imagine Marketing’s DRHP records restated consolidated profit of ₹80.37 million in FY2019, ₹477.98 million in FY2020 and ₹865.37 million in FY2021. But EBITDA margins were 6.26%, 12.47% and 10.15%, respectively. Earnings increased, while the margin improvement reversed in FY2021: revenue expansion did not produce uninterrupted margin expansion. These are the prospectus’s EBITDA margins, not its adjusted EBITDA margins. (DRHP)
The cash-flow record tells a different story. Net operating cash flow was negative ₹259.99 million in FY2019, positive ₹18.62 million in FY2020 and negative ₹1,421.01 million in FY2021. Thus, even the profitable FY2021 business consumed cash through operations rather than generating cash to fund its next stage of growth. Profit measured the accounting result; operating cash flow captured the cash outcome after operating receipts and payments. The distinction matters more than the profitable-growth label alone. (DRHP)
The divergence became sharper in the six months ended September 30, 2021. Restated profit was ₹1,183.15 million, but net operating cash flow was negative ₹6,058.30 million. This is a six-month reporting period, not another full financial year, and should not be annualised or treated as directly equivalent to the annual observations. It nevertheless establishes that substantial reported earnings and substantial operating cash consumption coexisted. (DRHP)
The prospectus explains the underlying funding requirement: working capital pays for finished-product inventories needed to maintain supply, alongside employee benefits, advertising and marketing, leases and logistics. Much of this expenditure comes before customer payments arrive. It also warns that reduced advances or longer customer payment schedules can increase receivables, short-term borrowing and funding costs. Outsourcing production therefore did not remove the need to finance the interval between procuring products and collecting cash. (DRHP)
The balance sheet shows the scale of that pressure. Trade receivables rose from ₹754.83 million at March 31, 2021 to ₹6,352.34 million at September 30, 2021. Borrowings rose from ₹415.33 million to ₹7,310.57 million at those respective dates. These are point-in-time balances, not cash-flow measures. Their increase is evidence of funding pressure, but not a complete reconciliation of the operating cash outflow: it would be wrong to attribute every rupee of additional borrowing to receivables. Borrowing provided funding, not additional earnings, and brought repayment and financing obligations. (DRHP)
The later profitability record needs separate treatment. Mint reports FY25 revenue of ₹3,097.81 crore and profit of ₹61 crore after losses in the preceding fiscal years. Its revenue figure’s accounting basis is not clearly distinguished, so it should not be joined to the older operating-revenue series to infer a continuous annual trajectory. Nor does that reported return to profit, without corresponding operating cash-flow evidence, establish that growth had become self-financing. (Mint)

Funding: private capital, a halted IPO and a smaller return
Mint’s October 31, 2025 report puts boAt’s private funding at nearly ₹1,350 crore ($162 million) over nine years. That is an aggregate, not a complete transaction history. It separately reports that Fireside Ventures invested ₹6 crore in May 2018 and Qualcomm Ventures invested ₹50 crore in May 2022; these disclosed investments do not explain the full funding total.
The earlier prospectus identifies Fireside subscription agreements dated April 4, 2018 and December 31, 2018, without amounts in the supplied excerpts. Those are agreement dates, not evidence of investment completion dates, and should not be substituted for Mint’s reported investment timing.
Imagine Marketing’s draft prospectus dated January 26, 2022 proposed an offer of up to ₹20,000.00 million: up to ₹9,000.00 million through a fresh issue and ₹11,000.00 million through an offer for sale (OFS). It named Sameer Mehta, Aman Gupta and South Lake Investment Ltd as proposed sellers. The headline offer was not all capital for the business: the fresh issue would finance the company, while the OFS would provide liquidity to selling shareholders.
According to Mint, that IPO process was halted because of market conditions. Its October 2025 report describes a smaller return to the public market: a proposed ₹1,500 crore offering, comprising ₹500 crore in fresh shares and ₹1,000 crore in OFS. These were proposed proceeds, not completed fundraising. The supplied sources do not establish the costs incurred in the halted process.
Mint is internally contradictory on the revised seller list: its early description includes promoters and Warburg Pincus, but later says Warburg and both founders are not selling and identifies Fireside and Qualcomm as recipients of the OFS proceeds. An unequivocal seller list therefore cannot be established from that report.
The proposed financing nevertheless has a clear business implication. Mint says the ₹500 crore fresh issue would support working capital, marketing and other expenses, with ₹150 crore, or 30%, earmarked for brand and marketing in the October 2025 proposal. The larger OFS component would not fund inventory, product development or distribution. Nor do the reported original investments and proposed aggregate OFS establish individual investor returns: the supplied record lacks the transaction detail needed to calculate them.
The organisation behind the consumer brand
Outsourced production did not eliminate boAt’s need for an organisation to manage it. As of September 30, 2021, Imagine Marketing employed 292 personnel and worked with 370 contractual personnel, according to its draft prospectus. Contractual personnel outnumbered employees; the operating model was not simply a small brand team buying finished goods.
The same prospectus reported attrition of 2.56% in FY2019, 13.51% in FY2020 and 11.92% in FY2021. Attrition eased in FY2021 but remained above FY2019. These figures establish a retention requirement, not its causes or the cost of replacing staff.
The prospectus also identified what expansion demanded internally: stronger inventory-purchase controls, broader internal audit coverage, recruitment and retention of skilled technical, sales and management staff, and improved operational and financial systems. Outsourcing production left purchasing discipline and organisational control inside the company. More products, manufacturers and distribution relationships required people and systems capable of coordinating them.
These were disclosed requirements, not evidence that every improvement had been completed. The supplied material does not isolate the cost of strengthening these capabilities or measure their resulting productivity gains.
Leadership continuity is less clear. Mint’s October 31, 2025 article reported that Sameer Mehta stepped down as chief executive on September 30 and described Aman Gupta as the brand’s public face. It did not explain Mehta’s reasons, succession or the resulting decision-making structure. Gupta’s visibility therefore cannot be treated as evidence that he assumed executive control.
The setback: smartwatch scale met a contracting market
boAt’s setback was uneven across categories. IDC data cited by Mint shows smartwatch sales falling from 7.5 million units in 2023 to 4.1 million in 2024, while earphone sales rose from 27.3 million to 28.7 million units over the same years. Audio retained volume momentum; smartwatches lost substantial scale. These are unit figures, not category revenue or profit, so they do not establish how much earnings each business contributed.
The competitive positions were different too. Mint identifies boAt as India’s third-largest smartwatch maker, behind Noise and Fire-Boltt, but the earphones leader in 2023 and 2024, with Boult and Noise its leading audio competitors. Its audio leadership therefore coexisted with a weaker position in watches: reach and recognition did not translate into equivalent standing across categories.
Mint describes a broader smartwatch contraction, but gives inconsistent market-decline figures—35% alongside its 2024 company comparison and 34% for 2024 later—and presents unclear current-year market totals, making the clearly dated company unit series the firmer basis for comparison. The contraction provides context for boAt’s decline, not a complete explanation of it. Mint’s account of near-identical products competing on price also describes industry conditions rather than isolating what drove boAt’s sales reduction.
The January 2022 draft prospectus had explicitly warned about this exposure. Its risk disclosures said weaker audio and wearables demand could hurt the business, competitors’ lower prices could reduce revenue and margins, and technological change could make products obsolete. It also warned that slowing demand ahead of new launches could require inventory write-downs. Read alongside the later unit results, these disclosures show why category expansion carried downside as well as growth potential. They do not prove the causes of subsequent losses or establish that those inventory costs materialised.
Falling sales are not evidence of deliberate retrenchment. Neither supplied source establishes a smartwatch exit, product-line shutdown or planned withdrawal of volumes. Nor do they quantify the smartwatch downturn’s financial cost. What is measurable is the divergence: the watch business contracted sharply while audio continued selling more units, leaving management facing different demand conditions within the same brand.
What happened next: can a value brand earn a premium?
As of October 31, 2025, boAt’s premium push was a strategy to improve margins, not a demonstrated transformation. Mint’s coverage of its draft IPO papers described plans to sell more expensive products, invest in R&D, create original designs and enter new categories. The proposed mechanism was differentiation rather than price alone. The reporting did not establish that these investments had already produced sustained premium demand or higher margins.
There was an existing research operation behind the ambition. Mint dated the formation of boAt Labs to January 2022 and reported R&D spending between 1.3% and 1.7% of revenue over the past three fiscal years. It supplied neither an annual breakdown nor a detailed future allocation by technology, product category or business area. That establishes spending, but not its commercial return: the source does not connect particular research outputs to customers paying more.
The difficulty was that moving upmarket could weaken the business boAt already had. Nirransh Jain, research analyst at BNP Paribas, told Mint that companies attempting this shift “may have to compromise on volumes”. IDC India’s Navkendar Singh likewise warned that changing product strategy and brand image in a stagnant market could cost customers and revenue. For a founder, the relevant test is therefore not simply whether a higher-priced range sells, but whether its contribution compensates for any loss of affordable-product volume.
Innovation also competes with the cost of maintaining scale. Jain identified channel distribution, portfolio expansion and working capital as competing claims on investment, warning that the industry often leaves R&D behind. Mint reported that the proposed fundraising earmarked ₹150 crore for brand and marketing expenses. By contrast, the future R&D allocation remained unspecified. Visibility had a stated budget; the product-development commitment was less clearly defined in the reporting.
Overseas expansion was similarly provisional. An anonymous senior executive, who cited the company’s IPO silent period, told Mint that boAt was in active talks with distribution partners in the UAE. Mint’s draft-paper coverage also identified south Asia and south-east Asia as target markets. No expansion timeline was offered. Partner discussions establish intent, not completed distribution or overseas sales.
The practical lesson is to separate commitments from outcomes. A premium strategy needs evidence of willingness to pay, not just a more expensive catalogue; research spending needs identifiable product outputs; and expansion needs funded distribution rather than a list of territories. At the latest supported reporting date, the unresolved question was whether boAt could finance those changes while preserving enough of its value business—and whether buyers would reward original products with margins that justified the transition.

By the numbers
| Metric | Period | Value | Source |
|---|---|---|---|
| Imagine Marketing consolidated revenue from operations | FY2019 | 2,258.49 | Imagine Marketing Limited DRHP (copy) |
| Imagine Marketing consolidated revenue from operations | FY2020 | 6,091.07 | Imagine Marketing Limited DRHP (copy) |
| Imagine Marketing consolidated revenue from operations | FY2021 | 13,137.16 | Imagine Marketing Limited DRHP (copy) |
| Imagine Marketing consolidated revenue from operations | Six months ended September 30, 2021 | 15,478.66 | Imagine Marketing Limited DRHP (copy) |
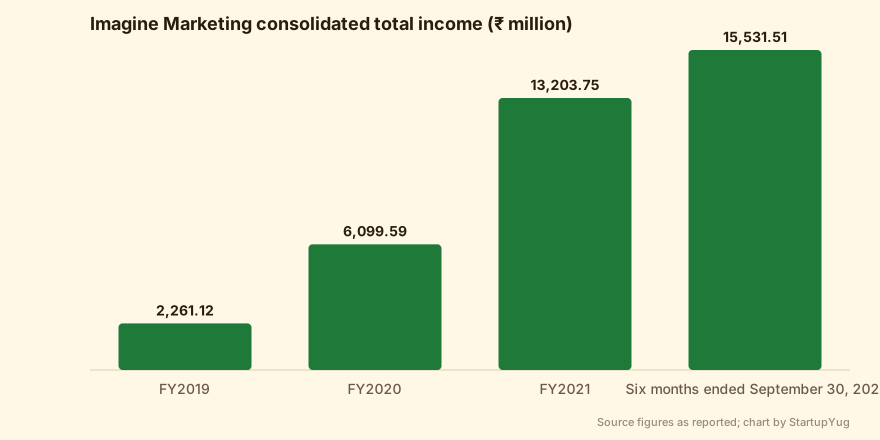
| Imagine Marketing consolidated total income | FY2019 | 2,261.12 | Imagine Marketing Limited DRHP (copy) |
| Imagine Marketing consolidated total income | FY2020 | 6,099.59 | Imagine Marketing Limited DRHP (copy) |
| Imagine Marketing consolidated total income | FY2021 | 13,203.75 | Imagine Marketing Limited DRHP (copy) |
| Imagine Marketing consolidated total income | Six months ended September 30, 2021 | 15,531.51 | Imagine Marketing Limited DRHP (copy) |
| Imagine Marketing consolidated restated profit | FY2019 | 80.37 | Imagine Marketing Limited DRHP (copy) |
| Imagine Marketing consolidated restated profit | FY2020 | 477.98 | Imagine Marketing Limited DRHP (copy) |
| Imagine Marketing consolidated restated profit | FY2021 | 865.37 | Imagine Marketing Limited DRHP (copy) |
| Imagine Marketing consolidated restated profit | Six months ended September 30, 2021 | 1,183.15 | Imagine Marketing Limited DRHP (copy) |
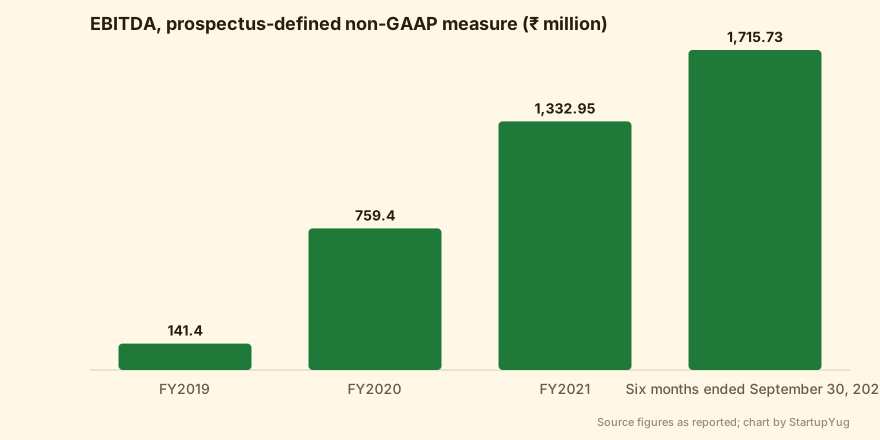
| EBITDA, prospectus-defined non-GAAP measure | FY2019 | 141.40 | Imagine Marketing Limited DRHP (copy) |
| EBITDA, prospectus-defined non-GAAP measure | FY2020 | 759.39 | Imagine Marketing Limited DRHP (copy) |
| EBITDA, prospectus-defined non-GAAP measure | FY2021 | 1,332.95 | Imagine Marketing Limited DRHP (copy) |
| EBITDA, prospectus-defined non-GAAP measure | Six months ended September 30, 2021 | 1,715.73 | Imagine Marketing Limited DRHP (copy) |
| EBITDA margin | FY2019 | 6.26% | Imagine Marketing Limited DRHP (copy) |
| EBITDA margin | FY2020 | 12.47% | Imagine Marketing Limited DRHP (copy) |
| EBITDA margin | FY2021 | 10.15% | Imagine Marketing Limited DRHP (copy) |
| EBITDA margin | Six months ended September 30, 2021 | 11.08% | Imagine Marketing Limited DRHP (copy) |
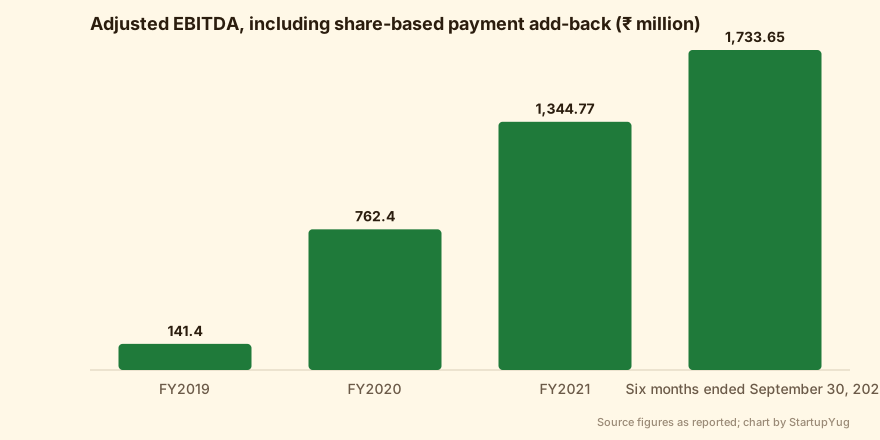
| Adjusted EBITDA, including share-based payment add-back | FY2019 | 141.40 | Imagine Marketing Limited DRHP (copy) |
| Adjusted EBITDA, including share-based payment add-back | FY2020 | 762.39 | Imagine Marketing Limited DRHP (copy) |
| Adjusted EBITDA, including share-based payment add-back | FY2021 | 1,344.77 | Imagine Marketing Limited DRHP (copy) |
| Adjusted EBITDA, including share-based payment add-back | Six months ended September 30, 2021 | 1,733.65 | Imagine Marketing Limited DRHP (copy) |
| Adjusted EBITDA margin | FY2019 | 6.26% | Imagine Marketing Limited DRHP (copy) |
| Adjusted EBITDA margin | FY2020 | 12.52% | Imagine Marketing Limited DRHP (copy) |
| Adjusted EBITDA margin | FY2021 | 10.24% | Imagine Marketing Limited DRHP (copy) |
| Adjusted EBITDA margin | Six months ended September 30, 2021 | 11.20% | Imagine Marketing Limited DRHP (copy) |
| Net operating cash flow | FY2019 | (259.99) | Imagine Marketing Limited DRHP (copy) |
| Net operating cash flow | FY2020 | 18.62 | Imagine Marketing Limited DRHP (copy) |
| Net operating cash flow | FY2021 | (1,421.01) | Imagine Marketing Limited DRHP (copy) |
| Net operating cash flow | Six months ended September 30, 2021 | (6,058.30) | Imagine Marketing Limited DRHP (copy) |
| Net investing cash flow | FY2019 | (2.46) | Imagine Marketing Limited DRHP (copy) |
| Net investing cash flow | FY2020 | (71.52) | Imagine Marketing Limited DRHP (copy) |
| Net investing cash flow | FY2021 | (66.56) | Imagine Marketing Limited DRHP (copy) |
| Net investing cash flow | Six months ended September 30, 2021 | (2,304.06) | Imagine Marketing Limited DRHP (copy) |
| Net financing cash flow | FY2019 | 208.23 | Imagine Marketing Limited DRHP (copy) |
| Net financing cash flow | FY2020 | 182.78 | Imagine Marketing Limited DRHP (copy) |
| Net financing cash flow | FY2021 | 2,707.77 | Imagine Marketing Limited DRHP (copy) |
| Net financing cash flow | Six months ended September 30, 2021 | 4,963.74 | Imagine Marketing Limited DRHP (copy) |
| Borrowings | March 31, 2019 | 267.35 | Imagine Marketing Limited DRHP (copy) |
| Borrowings | March 31, 2020 | 488.11 | Imagine Marketing Limited DRHP (copy) |
| Borrowings | March 31, 2021 | 415.33 | Imagine Marketing Limited DRHP (copy) |
| Borrowings | September 30, 2021 | 7,310.57 | Imagine Marketing Limited DRHP (copy) |
| Trade receivables | March 31, 2019 | 382.67 | Imagine Marketing Limited DRHP (copy) |
| Trade receivables | March 31, 2020 | 552.75 | Imagine Marketing Limited DRHP (copy) |
| Trade receivables | March 31, 2021 | 754.83 | Imagine Marketing Limited DRHP (copy) |
| Trade receivables | September 30, 2021 | 6,352.34 | Imagine Marketing Limited DRHP (copy) |
| Cash and cash equivalents, balance-sheet measure | March 31, 2019 | 0.22 | Imagine Marketing Limited DRHP (copy) |
| Cash and cash equivalents, balance-sheet measure | March 31, 2020 | 73.15 | Imagine Marketing Limited DRHP (copy) |
| Cash and cash equivalents, balance-sheet measure | March 31, 2021 | 1,443.93 | Imagine Marketing Limited DRHP (copy) |
| Cash and cash equivalents, balance-sheet measure | September 30, 2021 | 351.14 | Imagine Marketing Limited DRHP (copy) |
| Net worth | March 31, 2019 | 230.97 | Imagine Marketing Limited DRHP (copy) |
| Net worth | March 31, 2020 | 715.29 | Imagine Marketing Limited DRHP (copy) |
| Net worth | March 31, 2021 | 4,641.68 | Imagine Marketing Limited DRHP (copy) |
| Net worth | September 30, 2021 | 6,329.67 | Imagine Marketing Limited DRHP (copy) |
| Audio-category sales | FY2019 | ₹2,168.29 million | Imagine Marketing Limited DRHP (copy) |
| Audio-category sales | FY2020 | ₹5,947.07 million | Imagine Marketing Limited DRHP (copy) |
| Audio-category sales | FY2021 | ₹12,285.73 million | Imagine Marketing Limited DRHP (copy) |
| Audio-category sales | Six months ended September 30, 2021 | ₹12,867.96 million | Imagine Marketing Limited DRHP (copy) |
| Wearables-category sales | FY2021 | ₹548.05 million | Imagine Marketing Limited DRHP (copy) |
| Wearables-category sales | Six months ended September 30, 2021 | ₹2,175.16 million | Imagine Marketing Limited DRHP (copy) |
| Online marketplaces' share of revenue from operations | FY2019 | 85.11% | Imagine Marketing Limited DRHP (copy) |
| Online marketplaces' share of revenue from operations | FY2020 | 86.26% | Imagine Marketing Limited DRHP (copy) |
| Online marketplaces' share of revenue from operations | FY2021 | 85.84% | Imagine Marketing Limited DRHP (copy) |
| Online marketplaces' share of revenue from operations | Six months ended September 30, 2021 | 83.24% | Imagine Marketing Limited DRHP (copy) |
| Top two marketplaces' share of revenue from operations | FY2019 | 78.59% | Imagine Marketing Limited DRHP (copy) |
| Top two marketplaces' share of revenue from operations | FY2020 | 81.35% | Imagine Marketing Limited DRHP (copy) |
| Top two marketplaces' share of revenue from operations | FY2021 | 83.72% | Imagine Marketing Limited DRHP (copy) |
| Top two marketplaces' share of revenue from operations | Six months ended September 30, 2021 | 75.02% | Imagine Marketing Limited DRHP (copy) |
| Five most-used distributors' share of revenue, including modern retailers | FY2019 | 9.95% | Imagine Marketing Limited DRHP (copy) |
| Five most-used distributors' share of revenue, including modern retailers | FY2020 | 7.80% | Imagine Marketing Limited DRHP (copy) |
| Five most-used distributors' share of revenue, including modern retailers | FY2021 | 6.41% | Imagine Marketing Limited DRHP (copy) |
| Five most-used distributors' share of revenue, including modern retailers | Six months ended September 30, 2021 | 7.03% | Imagine Marketing Limited DRHP (copy) |
| Five most-used suppliers' share of stock-in-trade purchases | FY2019 | 57.79% | Imagine Marketing Limited DRHP (copy) |
| Five most-used suppliers' share of stock-in-trade purchases | FY2020 | 69.34% | Imagine Marketing Limited DRHP (copy) |
| Five most-used suppliers' share of stock-in-trade purchases | FY2021 | 57.19% | Imagine Marketing Limited DRHP (copy) |
| Five most-used suppliers' share of stock-in-trade purchases | Six months ended September 30, 2021 | 60.73% | Imagine Marketing Limited DRHP (copy) |
| Purchases and changes in inventories of stock-in-trade | FY2019 | ₹1,739.12 million | Imagine Marketing Limited DRHP (copy) |
| Purchases and changes in inventories of stock-in-trade | FY2020 | ₹4,496.74 million | Imagine Marketing Limited DRHP (copy) |
| Purchases and changes in inventories of stock-in-trade | FY2021 | ₹10,208.37 million | Imagine Marketing Limited DRHP (copy) |
| Purchases and changes in inventories of stock-in-trade | Six months ended September 30, 2021 | ₹12,085.65 million | Imagine Marketing Limited DRHP (copy) |
| Warranty expenses | FY2019 | ₹48.87 million | Imagine Marketing Limited DRHP (copy) |
| Warranty expenses | FY2020 | ₹273.47 million | Imagine Marketing Limited DRHP (copy) |
| Warranty expenses | FY2021 | ₹527.17 million | Imagine Marketing Limited DRHP (copy) |
| Warranty expenses | Six months ended September 30, 2021 | ₹657.70 million | Imagine Marketing Limited DRHP (copy) |
| Warranty expenses as share of revenue from operations | FY2019 | 2.16% | Imagine Marketing Limited DRHP (copy) |
| Warranty expenses as share of revenue from operations | FY2020 | 4.49% | Imagine Marketing Limited DRHP (copy) |
| Warranty expenses as share of revenue from operations | FY2021 | 4.01% | Imagine Marketing Limited DRHP (copy) |
| Warranty expenses as share of revenue from operations | Six months ended September 30, 2021 | 4.25% | Imagine Marketing Limited DRHP (copy) |
| Personnel attrition | FY2019 | 2.56% | Imagine Marketing Limited DRHP (copy) |
| Personnel attrition | FY2020 | 13.51% | Imagine Marketing Limited DRHP (copy) |
| Personnel attrition | FY2021 | 11.92% | Imagine Marketing Limited DRHP (copy) |
| Personnel attrition | Six months ended September 30, 2021 | 8.90% | Imagine Marketing Limited DRHP (copy) |
| Employees, point-in-time disclosure | September 30, 2021 | 292 personnel | Imagine Marketing Limited DRHP (copy) |
| Contractual workforce, point-in-time disclosure | September 30, 2021 | 370 persons | Imagine Marketing Limited DRHP (copy) |
| boAt smartwatch sales, IDC data reported by Mint | 2023 | 7.5 million | Mint |
| boAt smartwatch sales, IDC data reported by Mint | 2024 | 4.1 million | Mint |
| boAt earphone sales, IDC data reported by Mint | 2023 | 27.3 million units | Mint |
| boAt earphone sales, IDC data reported by Mint | 2024 | 28.7 million | Mint |
| Revenue as labelled by Mint; accounting basis not specified | FY25 | ₹ 3,097.81 crore | Mint |
| Profit as reported by Mint | FY25 | ₹ 61 crore | Mint |
Funding history
| When | Round | Amount | Investors | Source |
|---|---|---|---|---|
| May 2018 | Investment reported by Mint; round label not established | ₹ 6 crore | Fireside Ventures | Mint |
| May 2022 | Investment reported by Mint; round label not established | ₹ 50 crore | Qualcomm Ventures | Mint |
Timeline
| When | What happened | Source |
|---|---|---|
| November 1, 2013 | Imagine Marketing Private Limited incorporated in Mumbai. | Imagine Marketing Limited DRHP (copy) |
| 2014 / 2016 | The prospectus and company website date boAt’s launch or beginning to 2014; Mint reports a 2016 launch. The discrepancy is unresolved. | Mint |
| May 2018 | Fireside Ventures investment reported by Mint. | Mint |
| FY2021 | Wearables revenue appears after nil revenue in the preceding reported financial years. | Imagine Marketing Limited DRHP (copy) |
| January 2022 | boAt Labs formed, according to Mint. | Mint |
| January 26, 2022 | Initial draft IPO prospectus dated; Mint later reports that the process was halted because of market conditions. | Imagine Marketing Limited DRHP (copy) |
| May 2022 | Qualcomm Ventures investment dated by Mint; not independently corroborated by the supplied primary text. | Mint |
| 2023–2024 | boAt smartwatch sales fall while earphone sales increase, according to IDC data reported by Mint. | Mint |
| FY25 | Return to profit reported by Mint following consecutive loss-making fiscal years. | Mint |
| September 30, as reported in October 2025 | Sameer Mehta steps down as chief executive, according to Mint. | Mint |
| October 2025 | Mint reports a revised IPO proposal and a premium-product strategy; completion of the offering is not established. | Mint |
“It is tough to immediately realign the image of a brand to pursue a premium push. The market’s exponential growth has also taken a breather. This means companies trying to move up the value chain may have to compromise on volumes,”
— Nirransh Jain, research analyst, BNP Paribas, Mint
“In most cases, the industry prioritises other investments needed at scale, leaving R&D in the back seat.”
— Nirransh Jain, research analyst, BNP Paribas, Mint
What other founders can take from this
- Treat marketplace distribution as rented reach: monitor customer concentration, payment terms and unsold-stock obligations alongside sales.
- Plan working-capital funding separately from profitability because receivables and inventory can absorb cash even while reported profit rises.
- Evaluate warranty and replacement costs as part of the product proposition rather than assuming outsourced production transfers quality responsibility.
- Test each adjacent category on its own demand and economics instead of treating an established audio brand as proof that wearables will remain attractive.
- Build evidence of product differentiation before assuming an affordable brand can command premium prices without losing volume.
- Separate fresh capital available to the business from shareholder liquidity when assessing what an IPO can fund.
- Strengthen procurement controls, forecasting and internal systems as distribution expands, rather than judging organisational readiness by brand visibility.
Sources
- https://yourstory.com/2022/03/boat-parent-imagine-marketing-house-of-brands-ipo-vivek-gambhir
- https://www.goldmansachs.com/worldwide/india/ipo/imagine-marketing-limited/UDRHP-I.pdf
- https://www.boat-lifestyle.com/pages/who-are-we
- https://www.livemint.com/companies/news/boat-ipo-boat-drhp-imagine-marketing-ipo-size-boat-premium-strategy/amp-11761820087005.html
- https://planify-main.s3.amazonaws.com/media/stock/document/uploadReport/imagine-marketing-limited-drhp.pdf
- https://www.boat-lifestyle.com/blogs/news/co-founder-aman-gupta-has-plugged-into-a-new-zone-with-boat
- https://www.boat-lifestyle.com/blogs/news/the-bro-code-meet-the-sound-industrys-new-disruptors
- https://www.businesstoday.in/magazine/deep-dive/story/heres-what-makes-boat-a-brand-for-india-and-by-indians-412060-2024-01-05
- https://www.boat-lifestyle.com/blogs/news/boat-lifestyle-addressing-the-issues-faced-by-millennials
- https://hindi.moneycontrol.com/news/business/boat-reported-a-38-per-cent-growth-in-profit-in-fy26-revenue-is-rs-2931-crore-2434885.html
- https://www.business-standard.com/amp/article/pti-stories/boat-raises-rs-6-cr-from-fireside-ventures-118050301355_1.html
- https://www.livemint.com/companies/start-ups/innoven-doubles-down-on-debt-financing-demand-from-consumer-startups/amp-1564078217814.html
- https://economictimes.indiatimes.com/small-biz/startups/newsbuzz/innoven-capital-invests-rs-25-crore-in-boat/articleshow/77864418.cms?from=mdr
- https://www.boat-lifestyle.com/en-sg/blogs/news/announcing-boats-100-million-funding-by-warburg-pincus
- https://economictimes.indiatimes.com/tech/funding/qualcomm-ventures-invests-in-boat-at-estimated-valuation-of-rs-2200-crore/articleshow/82103740.cms?from=mdr
- https://indianexpress.com/article/business/boat-raises-rs-500-crore-from-warburg-pincus-affiliate-malabar-investments-8234688/
- https://retail.economictimes.indiatimes.com/news/consumer-durables-and-information-technology/consumer-electronics/bollywood-actor-ranveer-singh-invests-in-audio-wearables-brand-boat/107310530?commentid=107310530&frmsrc=amp_news_comment
- https://www.financialexpress.com/market/stock-insights/boats-ipo-reality-check-from-shark-tank-fame-to-a-rs-1500nbspcrorenbsplisting/4053457/
- https://economictimes.indiatimes.com/tech/startups/boat-raises-100-million-in-funding-from-warburg-pincus/articleshow/80125590.cms?from=mdr
- https://www.indiainfoline.com/news/markets/boat-gets-60-million-in-funding-from-warburg-pincus-malabar
- https://inc42.com/company/boat/funding/
- https://www.moneycontrol.com/news/business/ipo/five-key-takeaways-from-boats-ipo-prospectus-7992221.html
- https://inc42.com/startups/how-boat-is-striking-a-chord-with-millennials-and-competing-with-the-likes-of-apple-bose-in-india/
- https://yourstory.com/2021/09/boat-sailed-and-how-aman-gupta-indian-startup-funding-news
- https://yourstory.com/2023/01/boat-revenue-up-11867-while-profits-down-206
- https://www.business-standard.com/companies/news/boat-logs-rs-4-000-cr-in-net-sales-makes-15-mn-products-in-india-in-fy23-123061500877_1.html
- https://images.moneycontrol.com/news_html_files/pdffiles/Oct2025/imagine-marketing.pdf
- https://www.exchange4media.com/announcements-news/boat-reports-rs-3000-crore-revenue-in-fy25-148139.html
- https://inc42.com/buzz/boats-fy24-revenue-declines-7-to-inr-3118-cr/
- https://www.vccircle.com/fireside-ventures-backs-consumer-electronics-startup-boat
- https://www.ibef.org/news/boat-lifestyle-eyes-rs-1000-crore-revenue-in-fy24
- https://www.boat-lifestyle.com/pages/2-million
- https://www.business-standard.com/markets/ipo/boat-parent-files-updated-drhp-with-sebi-cuts-issue-size-to-1500-crore-125102900766_1.html
- https://www.boat-lifestyle.com/collections/all
- https://www.boat-lifestyle.com/collections
- https://www.businesstoday.in/amp/markets/ipo-corner/story/boat-parent-imagine-marketing-files-updated-drhp-for-rs-1500-crore-ipo-check-details-500014-2025-10-29
- https://retail.economictimes.indiatimes.com/amp/news/consumer-durables-and-information-technology/consumer-electronics/boat-lifts-domestic-manufacturing-share-to-76-as-localisation-accelerates/125484002
- https://www.moneycontrol.com/news/business/startup/boat-ipo-decoded-smaller-issue-size-profit-tailwinds-wearables-slump-and-key-risks-13641296.html
- https://www.vccircle.com/warburgpincus-backed-boat-s-net-profit-jumps-38-even-as-revenue-slides
- https://www.financialexpress.com/business/wearables-slowdown-puts-boat-in-choppy-waters-ahead-of-ipo-4008164/